Today I discovered…
Evidence
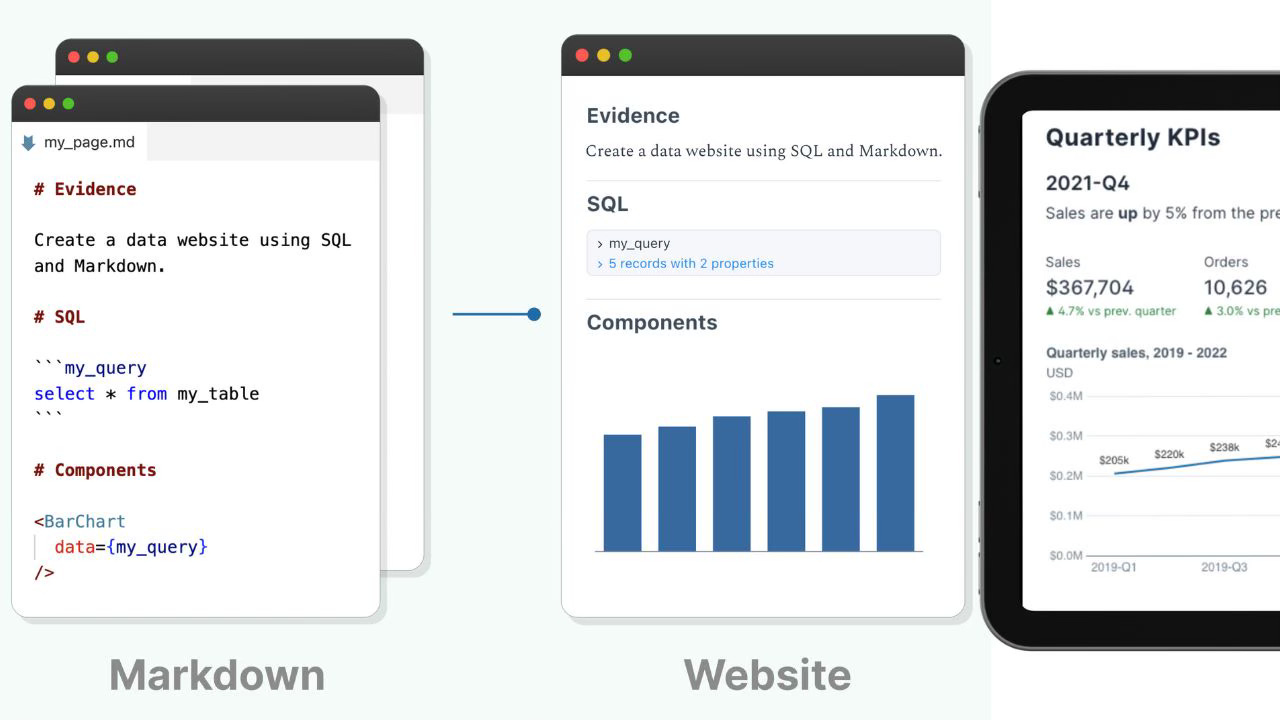
Evidence is a code-based alternative to drag-and-drop business intelligence (BI) tools. It creates a website from markdown files by running SQL statements and making charts from the results.
💖 What I like about Evidence:
Rich charting capabilities - has all the charts I wanted including calendar heatmap and sankey
Rich ui components and interactivity (filters, search, comparison, etc.)
It caches the data beforehand, so no huge cost even if it is accessed for million times. Perfect for data journalism use case (where the audience is public)
Good aesthetics - minimalistic and visually appealing
Can be used to bring together vizualization in the same repo as dbt project for materialization
👎 What I dislike about Evidence:
It runs query beforehand and caches it, even if you need it infrequently for internal usage
Overall, it feels like a missing feature in dbt. While using it along with dbt, seems like redoing stuff (the query/transformation) which was done to certain extent already in dbt.
A slight learning curve (not so much but it didn’t have to be this much either)
Cannot be hosted on GitHub pages directly, would have been more appealing if it were
⭐ Ratings and metrics
Based on my experience, I would rate this project as following
Production readiness: 7/10
Docs rating: 6/10
Time to POC(proof of concept): less than a week
Author: Brian D, Sean, Archie Sarre Wood, Adam, and Evidence team
Demo | Source
Tech Stack: JavaScript, Svelte, Node.jsIf you discovered an interesting Open-Source project and want me to feature it in the newsletter, get in touch via the form above. To support this newsletter and Open-Source authors, follow #OpenSourceDiscovery on LinkedIn and Twitter


